So I've now got a few hundred recordings from my Bat Logger, collected over a number of nights.
Time to settle down with Audacity and a pint of IPA, and analyse a bunch of waveforms.
Identifying the bat in question is easy, right? Its just a matter of determining frequency, repetition rate...
...call width, and "Bingo!" ...err, its some kind of a bat.
I've been running my bat logger from a 1st floor window (about 4.5m above ground) and from a 2nd floor window (about 7.5m) over-night for a few of the dry nights during the last couple of weeks. Its typically switched on about 20minutes after sunset, and then switched off whenever I get back to it in the morning (usually by 8/8:30am).
During a typical night run, the logger makes between 70-100 recordings. Some of these are more or less blank (e.g. they were triggered by a short group of pulses followed by nothing) and some are not recognisable as anything but noise (i.e. no dominant frequency, just a burst of stuff).
Last nights run was the first using the MC33079 op-amp in the detector, and I'm wondering if it is now just too sensitive. As an example, this morning I put the detector in the conservatory and stood as far away as I could get inside the kitchen, while I buttered my toast. At a range of 9.5m the detector reacted. I pretty sure it would have still reacted at 12-15m.
So it could be that a lot of the junk recordings are generated by ultrasonic signals from leaves blowing in the wind, insects flying by at close range, or even traffic on the main road, which is a little over 50m away. But putting these rouges aside, I still have lots of apparently 'real' bat recordings.
system generated signal anomalies
The are 3 displays that I use in Audacity for analysing these waveforms:-
- Oscillogram: time/amplitude, like the display on an oscilloscope
- Power spectrum: frequency/dB level, like a spectrum analyser display
- Spectrogram: time/frequency, also called sonogram
It is worth noting that some of the characteristics I see using Audacity are due to the hardware.

For example, some signals appear positive going, while others are negative. During quiet periods, the output from the detector (the divide by 8 chip) may come to rest at 0Volts or 5Volts. The attenuator circuit that follows the divider is AC coupled, so when the detector output changes state, the coupling capacitors are either charged or discharged, creating an apparent negative or positive going response. (The time constants {capacitor/resistor values} in the attenuator are probably all wrong, but its not a critical issue, so I wont be spending any time on it just now).

This also accounts for the apparent signal "drift" at the start and end of a bat call (see above) as the waveform becomes centred on the baseline.
Another point is that my frequency division detector produces a square-wave output. So in addition to the fundamental frequency, the output is rich in odd harmonics (especially 3rd & 5th), which should therefore be ignored when using the Spectrogram or frequency analysis view.
analysing a recording with Audacity
So here is a bat recording from last night;

This sequence of calls (apparently a bat "call" is defined as a burst of signal) includes wide ones (typically between 50-100ms) and short ones (typically 5-6ms). The long calls have a short intro, a short break, then the long part of the call.

By highlighting the "intro" and viewing the power spectrum (menu Analyse > Plot Spectrum then move cursor to peak), I can see that the dominant frequency (the highest peak) is 5770Hz.
What I'm calling the "dominant frequency" is sometimes called the "peak frequency" (Oh yuk!) or better referred to as "FmaxE" (the frequency of maximum energy).
Remember that I'm using a divide by 8 circuit, so the actual call frequency is 8 x 5.77 = 46kHz.
By viewing one of these long pulses as a spectrogram, I can see the variation in frequency;
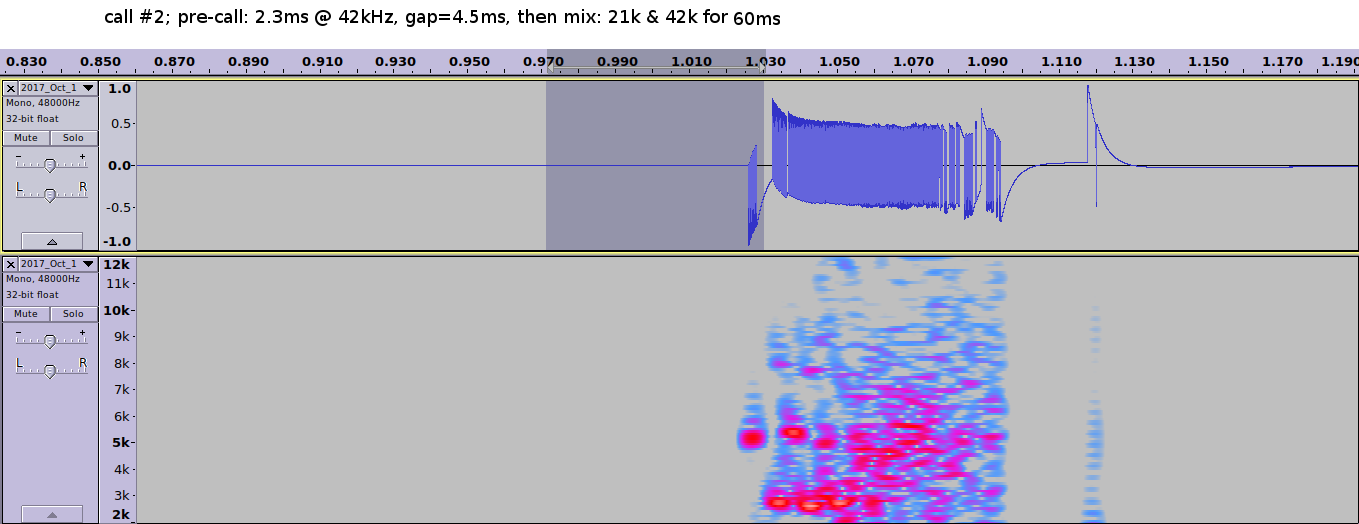 |
| KEY: strongest to weakest levels are represented by; white > red > magenta > dark blue > light blue > grey |
After the initial 46kHz intro, the longer part of the call starts by alternating between 21kHz and 42kHz, and then it all gets a bit fuzzy.
A bit further along this sequence of calls, and the picture changes;

Here we have a call with a dominant frequency of approx 100kHz, followed by a longer call with prominent low and medium frequencies. There appears to be stuff from the low 20k region up to the high 40-50kHz range. The last call is again in the 90-100k range.
The final illustration from this call sequence shows a short pair of calls (the first at 48kHz, the second in the 90-100kHz range).

This pattern repeats once again, but with a wider gap between pulses.
I use the "gap" between pulses when there isn't a pattern, and "period" when there is. The common bat analysis term "interval" is misleading because its used to indicate the signal call period, whereas "interval" in common speech is generally a gap or break (e.g. the interval in a theatre performance).
The final call on the right in the above spectrogram is similar to the long call on the left, which contain a mixture of frequencies, starting low and rising within the 40-50kHz range.
its a bat Jim, but not as we know it!
So with all this valuable data we should be able to play "guess the bat".
I've read tons of stuff on the net and I've even bought a copy of the British Bat Bible (a.k.a. "British Bat Calls" by Jon Russ). But so far I've not been able to make an intelligent guess as to what kind of bat made this call. Jon's book includes lots of spectrograms for each of the native species, but so far I have not been able to match this one to any of them.
I understand that bat calls get a little more complicated when the bat environment is "cluttered". Although looking out of my 2nd story window, it doesn't look that cluttered to me (...but then, I'm not a bat!). So I guess I just need to work through a lot more of my recordings and develop an eye for it.
basic procedure/config when using Audacity
When I first started using Audacity I had a real problem trying to get a spectrogram to look like any of the published illustrations. So maybe its worth jotting down a few notes here.
Opening a .wav file (recording) in Audacity initially displays the oscillogram view. If the amplitude looks low, it may be worth selecting menu Effect > Amplify... to pump up the displayed signal.
Assuming you just have a single track, use menu Edit > Duplicate to create a copy, then use this track's drop-down menu to select Spectrogram. From the same menu, select Spectrogram Settings... to set the minimum & maximum frequency for the y axis.

As my frequency division detector is a "divide by 8" system, I've chosen 2kHz and 15kHz, giving an effective range from 16kHz to 120kHz. Using a Hanning window with a size of 512 seems to be an acceptable compromise.
The tricky bit is adjusting Gain and Range to give a sensible display. With the Audacity default settings, my display looks like this;

Much of the detail is completely lost in the white (high signal level) areas because there is too much gain. So I suggest you start with Gain set to 0, then slowly increase it until small white areas are just clearly visible.

Now adjust Range to remove much of the unwanted background.
 |
| The light blue areas are the least important, so maybe range can be reduced even further |
You need to be able to see areas which include the major colours; white, red, magenta, dark blue & light blue, set against a grey background.
Once correctly set, these settings should be usable for all recordings from the same FD detector.
You may find that your settings return to default values each time Audacity is restarted. On my version of Audacity (v2.1.2 running on Linux) these settings are persistent only if you set them via menu Edit > Preferences... > Tracks > Spectrograms, rather than the route mentioned above.
No comments:
Post a Comment